The Latest Buzz
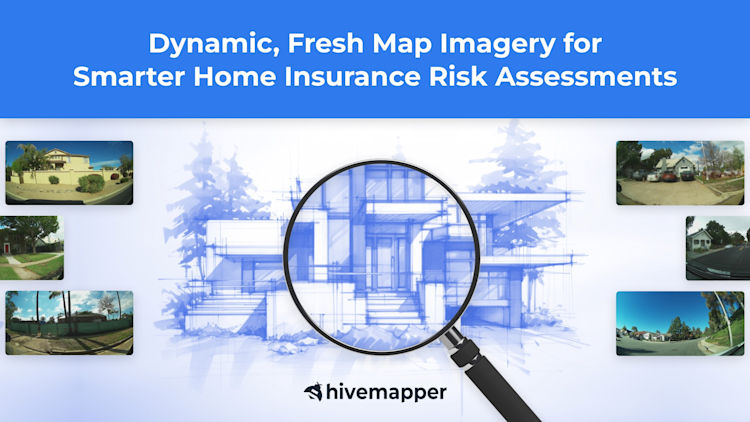
Dynamic, Fresh Map Imagery for Smarter Home Insurance Risk Assessments

Hivemapper’s imagery can help insurers create a detailed profile of property conditions and the surrounding neighborhood.
Accurately evaluating risks and pricing home insurance policies is a multifaceted challenge for insurers. With limited visibility into hyperlocal conditions and individual property attributes, underwriters and claims adjusters often lack the complete picture they need to make data-driven decisions. This visibility is further restricted by the limitations of common map products for street-level imagery, such as Google Street View, which often provide outdated and thus unreliable data for current assessments.
Hivemapper offers rich, current visual data that can bolster traditional methods of property evaluation. By enabling insurance assessors to virtually navigate through neighborhoods and inspect individual properties, Hivemapper provides a dynamic tool for identifying and quantifying potential risks and hazards.
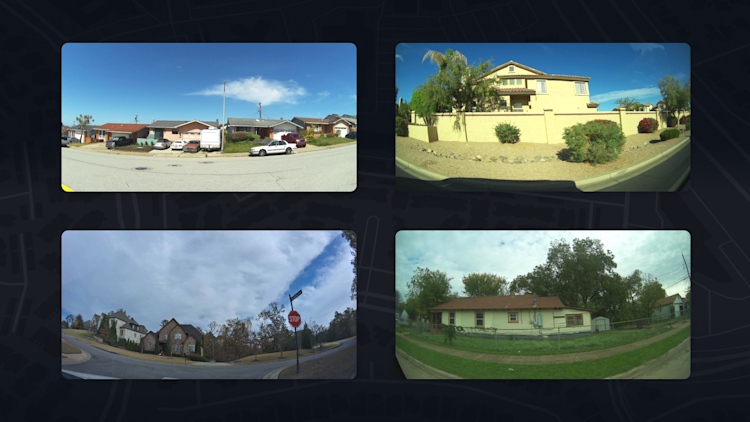
Hivemapper’s network provides rich, up-to-date visual data about neighborhoods and individual properties through its Map Image API, giving insurers a detailed view of a property’s condition without the need for an on-site visit. This fresh, high-resolution imagery allows insurance assessors to virtually “drive by” a home to review its exterior condition, surrounding environment, potential risks, and proximity to hazards like busy roads.
Visit our product page and contact sales to learn more. To get started, generate an API key.
Visual data is extremely helpful in evaluating factors relevant to home insurance underwriting and pricing, such as:
Home Exterior Condition
The imagery can reveal damage, structural issues, or maintenance needs that may indicate higher risk. Assessors can look for broken windows, peeling paint, damaged roofs, rotting materials, or other visible wear and tear. Such details can help them evaluate the risk level associated with a property and set appropriate insurance premiums.
Neighborhood Quality
Visual data can extend the assessment to encompass the broader neighborhood. Unkempt properties, vacant buildings, graffiti, or litter may correlate with a higher risk of accidents or property crime. Assessors can spot these visual cues to gauge neighborhood quality and potential risks without physical site visits.
Property Updates and Maintenance
Visual data can also show recent changes to a property, such as renovations or additions that could affect the value of the home and therefore the insurance coverage needed. Regular updates can prompt reassessment of the property, ensuring that coverage remains appropriate.
Road Conditions
Map imagery provides views of neighborhood road quality, like potholes, cracked pavement, or lack of sidewalks, which can impact insurance premiums and risks.
Environmental Changes
A review of targeted imagery over time can highlight changes in the environment surrounding a property, such as the development of flood-prone areas or the removal or substitution of traffic features, which could impact the risk profile of the property.
Potential Hazards
Overhanging trees and branches near roofs can be identified via imagery and flagged as risks. Visual data can also reveal patterns like poor drainage that indicate flood risk, or close proximity to dense vegetation that might heighten wildfire dangers. It can also clarify a property’s exposure to road hazards.
Catastrophe Modeling and Planning
Insurers use catastrophe models to predict the impact of disaster events. Hivemapper’s data can feed into these models, providing up-to-date information on the ground conditions and infrastructure, thus enabling more accurate modeling.
By synergizing Hivemapper’s visual data with other data sources such as property records, historical claims data, and peril models, insurers are equipped with a more complete view of risk factors at both the hyperlocal and property-specific levels. This enables smarter underwriting decisions, more precise risk assessments, and fairer claims assessment, ensuring that insurers can manage their portfolios with the current, granular intelligence necessary for accurate pricing and risk mitigation.
The granularity of the data provided by Hivemapper ensures that insurance professionals can make well-informed decisions, ultimately leading to more accurately priced policies, improved customer satisfaction, and a stronger bottom line for insurance companies. **
Follow us on X (Twitter) and join our Discord.
Share Post


